|
By Eric Lawrey, Copyright 1997 - 2001
3.1 Simulated Model
3.1.1 Forward Link
The forward link of the CDMA system modelled
uses orthogonal Walsh codes to separate the users. Each user is randomly
allocated a Walsh code to spread the data to be transmitted.
The transmitted signals from all the users
are combined together, then passed through a radio channel model. This
allows for clipping of the signal, adding multipath interference, and adding
white gaussian noise to the signal.
The receiver uses the same Walsh code that
was used by the transmitter to demodulate the signal and recover the data.
After the received signal has been despread using the Walsh code, it is
sub-sampled back down to the original data rate. This is done by using
an integrate-and-dump filter, followed by a comparator to decide whether
the data was a 1 or a 0.
The received data is then compared with
the original data transmitted to calculate the bit error rate (BER).
The RMS amplitude error is also worked
out. The signal level after it has been demodulated and filtered is compared
with the expected amplitude of the signal based on the transmitted data.
The RMS amplitude error directly relates to the bit error rate, so is a
useful measurement to make.
Figure 33 shows the model used for the
simulations of the CDMA forward link.
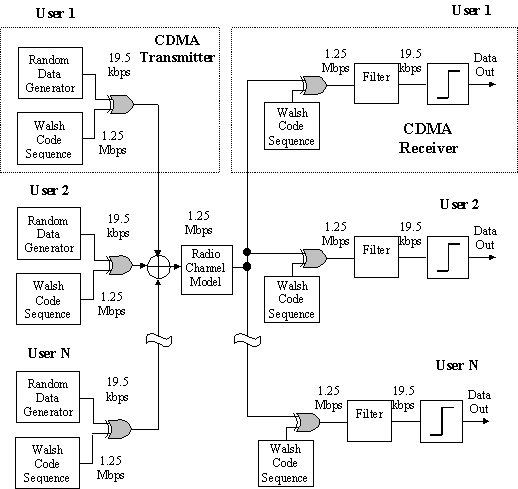
Figure 33 Model used for the CDMA forward link.
3.1.2 Reverse Path
The reverse link of the CDMA link was simulated
in a very similar way to the forward link except that orthogonal Walsh
codes are not used. As shown earlier it is extremely difficult to use orthogonal
codes effectively in a reverse link from the mobiles to the base station,
because of the difficulty in synchronizing the system accurately enough.
Because of this simply long pseudo random codes were used instead of the
Walsh codes.
3.2 Simulation Results
3.2.1 BER verses the number of users in a cell
The reverse links of a CDMA system, from
the mobiles to the base station, use non-orthogonal codes, which are pseudo
random noise codes (PN codes). This leads to the signals from each user
interfering with each other. The signals transmitted by each user are uncorrelated
with each other as each user uses a unique pseudo random sequence code,
resulting in the signal appearing a noise to other users.
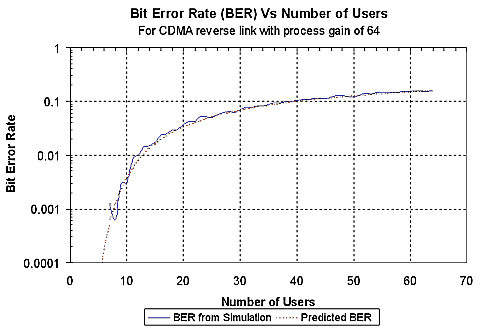
Figure 34 BER verse the number of users in a cell, for the reverse link in a CDMA
system.
The BER for the reverse link of a CDMA
system, increase as more users use the same cell. Figure 34 shows the BER
expected base on the number of users in a cell. This result, is for an
isolated cell with no interference from neighbouring cells, no multipath
effects, and no channel noise. Any of these effects would worsen the BER.
From Figure 34 it can be seen that the BER becomes significantly large
if the number of users is greater then 8 users. This represents only 12.5%
of the total user capacity of 64 users. The maximum number of users in
the cell can be increased by using, advanced forward error correction,
voice activity detection, and cell sectorization.
For computer transfer applications such
as wireless local area networks, the data load is generally in bursts.
This allows a reduction in the duty cycle of each user which is similar
to voice activity detection. This can lead to a vast increase in the number
of users possible as the interference from each user is reduced. However,
it is at the cost of total data throughput of each user.
It is clear from the result obtained from
Figure 34 that the inter-user interference in the reverse link is the weak
point in the CDMA system. It is this interference that limits the cell
capacity to approximately 8-12 users.
3.2.2 Multipath Immunity
CDMA is inherently tolerant to multipath
delay spread signals as any signal that is delayed by more than one chip
time becomes uncorrelated to the PN code used to decode the signal. This
results in the multipath simply appearing as noise. This noise leads to
an increase in the amount of interference seen by each user subjected to
the multipath and thus increases the received BER.
Figure 35 shows the effect of delay spread
on the reverse link of a CDMA system. It can be seen that the BER is essentially
flat for delay spreads of greater than one chip time (0.8 msec),
which is to be expected as the reflected signal becomes uncorrelated.
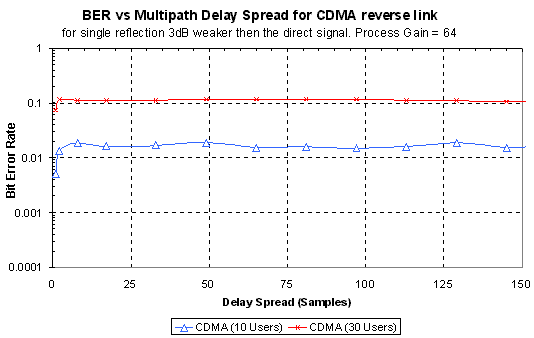
Figure 35 Effect of multipath delay spread on the reverse link of a CDMA system.
The multipath delay spread leads to an
increase in the equivalent number of users in the cell, as it increases
the amount of interference seen by the receiver.
Figure 36 shows a how the multipath power
leads to an increase in the effective number of users in the cell. This
simulation was performed using a fixed number of users in the CDMA link.
A multipath signal of 10 samples in delay (to ensure that it is uncorrelated)
was then added. It was found that as the amplitude of the reflected signal
was increased, so did the bit error rate (BER). This BER was compared with
Figure 34 to find out the equivalent number of users that result in the
same BER.
The addition of multipath to the signal
increases the total interference in the cell. The level of this increase
is proportional to the number of users in the cell and the multipath signal
strength. Figure 36 also shows the predicted result based on the increase
interference power.
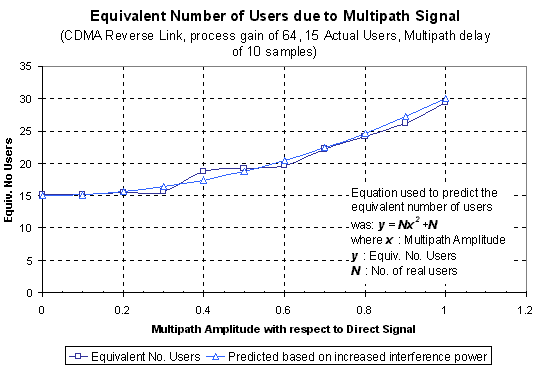
Figure 36 Interference increase seen by the receiver due to multipath delay spread.
(x is the multipath amplitude, thus x2 is the multipath power)
3.2.3 Peak Power Clipping
The distortion tolerance of any transmission
technique is very important, as it determines what type of power amplifier
can be used, and how much dynamic range overhead is required. If a transmission
technique is tolerant to peak power clipping, then it allows the signal
to be clipped. This clipping of the signal reduces the peak to RMS signal
power ratio thus allowing the signal power to be increased for the same
sized transmitter. Figure 37 shows the effect of peak power clipping on
both the reverse and forward links for CDMA.
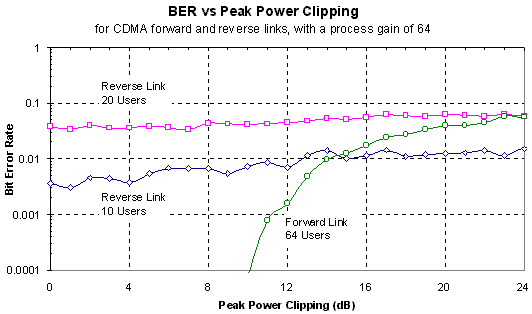
Figure 37 Effect of peak power clipping on the BER for the forward and reverse
links of CDMA.
For the reverse link the BER starts high
initially due to inter-user interference. The peak power clipping of the
signal has little effect on the reverse link because the extra noise due
to the distortion is not very high compared with the inter-user interference,
plus any added noise is reduced by the process gain of the system. Peak
power clipping for the reverse link is also likely to be small, as clipping
would only ever occur due to distortion in the base station receiver, as
this is the only point where all the signals are combined. A well-designed
receiver is unlikely to cause significant clipping of the signal and thus
the result shown in Figure 37 is not very important.
(Addendum 10/2001:
CDMA mobile phones require that the CDMA signal is band-pass filtered before
being transmitted. This is to prevent interference between neighbouring
channels. This band pass filtering changes the transmitted signal from
a simple binary phase transmission (i.e. constant amplitude) to one that
varies continuously in amplitude. This variable amplitude requires linear
amplification, and is thus affected by distortion. This means that some
distortion is likely to result in each of the mobiles, as well as the base
station).
The forward link result is more important
as significant clipping of the transmitted signal could occur at the base
station transmitter. The result for the forward link is completely different
to the reverse link. The peak power clipping tolerance of the forward link
is very similar to the result obtained for OFDM (see Figure 18 in section
2.2.2). The BER is low for a peak power clipping of less then 10dB, above
which the orthogonal nature of the Walsh codes used begins to collapse.
3.2.4 Channel Noise
The noise performance of the CDMA reverse
link is shown in Figure 38. This shows that the BER rises as the SNR of
the channel worsen. Due to the high level of inter-user interference the
addition of channel noise leads to only a gradual rise in the BER. The
BER of each of the lines (10 user, 20 users and 30 users) approaches approximately
the same BER at a SNR of 0 dB. At 0dB the effect noise of the channel is
the same as adding an additional 64 users to the cell, thus the difference
between 10, 20 and 30 users becomes insignificant. The BER is very bad
for more than 10 users regardless of the channel SNR, thus making 20 or
30 users unusable. However, for 10 users the BER becomes greater the 0.01
at approximately a SNR of 14 dB, which is the maximum BER that can be normally
tolerated for voice communications.
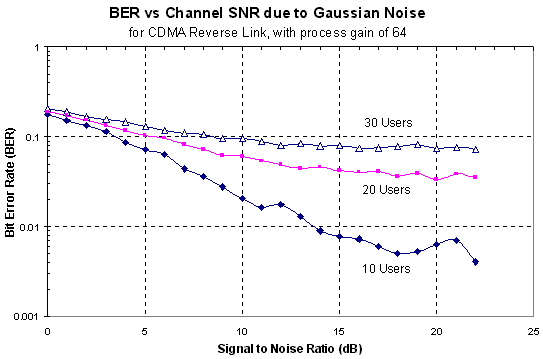
Figure 38 BER verses the radio channel SNR for the reverse link of a CDMA system.
3.3 Mathematical Model for Reverse Link
3.3.1 Cell Capacity for a CDMA system
The capacity of a CDMA system is limited
by the reverse link. The reverse link uses uncorrelated, non-orthogonal
PN codes, which makes it limited by interference from other users. Each
other user appears as noise as additional noise to the cell. If we initially
assume a single cell then the noise in the system will be determined by
the number of users in the cell. If we let the number of users be N, and
the transmitted power from each user to be S, the received signal will
consists of the received signal power for the desired user (S) and the
interference from N-1 other users, thus the signal to noise ratio will
be:

Since the noise in the channel is reduced
by the process gain during demodulation, the noise on each data bit seen
after demodulation will be less. The process gain is the ratio of the total
bandwidth (W) to the base band information bit rate (R). Thus the received
energy per bit to noise ratio (Eb/No) is

The above equation does not take into account
thermal noise. The thermal noise simply increased the effective amount
of noise. Let the thermal noise be n. Thus, the Eb/No
becomes

In order to achieve an increased capacity,
the interference from users needs to be reduced. This can be achieved by
monitoring the voice activity so that the transmitter is switched off during
periods of no voice activity. This reduces the effective interference level
by the reduced duty cycle of the transmitted signal. The interference can
also be reduced by using antenna sectorization. If for example the cell
was sub divided using three antennas, each having a beam width of 120°,
then the interference seen by each antenna is one third that of an omni-direction
antenna. If we let d be the duty cycle of the voice activity,
and G be the cell sectorization then equation becomes

Thus the capacity of a single cell CDMA
system would be
Equation 2

Where:
G is the antenna sectorization,
d is the voice duty cycle,
Eb/No is the energy per bit to noise ratio,
W is the total transmission bandwidth,
R is the base band bit rate,
n/S is the ratio of received thermal
noise to user signal power.
3.3.2 Capacity of a single CDMA cell
The cell capacity of a CDMA system is dependent
on the bandwidth used the process gain and the allowable error rate. For
this discussion we will consider the a system with the same bandwidth and
user data rate the same as the OFDM example system in section 2.6.
The OFDM example used a bandwidth of 1.25MHz.
The OFDM system could handle 64 users each at 39 kbps, or 128 users at
19.5 kbps depending on the spectrum allocation. For CDMA if we use a process
gain of 64, this will give each user a data rate capacity of 19.5 kbps,
making it comparable to an OFDM system with 128 users. Since the capacity
of a CDMA system is dependent on the noise tolerance of data if we assume
an Eb/No of 8dB this will give a BER of ~0.006 which is acceptable
for voice communications (see Table 23 in Appendix III for more detail).
For a the CDMA link that has no voice detection activity and no cell sectorization
then cell capacity can be calculated using Equation 2 as follows:
G = 1, d = 1, Eb/No
= 8 dB = 6.31, W = 1.25 MHz, R = 19.5 kHz and n/S
= 0 (Assume no thermal noise)
From Equation 2:

This gives a spectral efficiency of only:

This result is pretty poor as the cell
capacity is more then 10 times lower then it was for OFDM. However the
efficieny of CDMA can be improved by using voice detection to reduce the
duty cycle of each user, and by using cell sectorization. Note however,
that voice activity detection can only be used for voice communications
and not for general data transfer. Thus all it is effectively doing is
reducing the data throughput allowed for each user.
Appling both voice duty cycle detection
and cell sectorization the effective capacity is increased. If we assume
that the cell is split three ways then the ideal cell sectorization factor
will be 3. However, sidelobes of the antennas used will always reduce this,
there reducing the factor to about 2.55.
Using G = 2.55, d = 0.4 (i.e.
40%) the cell capacity becomes:

The spectral efficiency is thus

This is still half the capacity of the
OFDM system, and it comes at the cost of reduced total data throughput.
Table 19 shows how the over capacity of the CDMA system changes depending
on what BER is allowed. This is different to OFDM as the BER is ideally
0 even for 128 users as in the above example.
| Eb/No(dB) |
Expected Bit Error Rate (BER) |
Max. No. Users for single cell (no voice detection, no cell sectorization) |
Spectral Efficiency (bits/Hz) |
Max. No. Users for single cell (voice detection, cell sectorization) |
Spectral Efficiency (bits/Hz) |
| 6 |
0.023007 |
17.1 |
0.267 |
103.6 |
1.62 |
| 8 |
0.006004 |
11.1 |
0.173 |
65.7 |
1.03 |
|
10
|
0.000783
|
7.4
|
0.116
|
41.8
|
0.65
|
|
12
|
3.43E-05
|
5.0 |
0.078 |
26.5 |
0.41 |
Table 19 Predicted cell capacity for a single CDMA cell with process gain of
64, depending on the tolerable Eb/No
3.3.3 Capacity of CDMA and OFDM with Multiple Cells
With any cellular system, interference
from neighboring cells lowers the overall capacity of each cell. For conventional
FDMA and TDMA systems, each cell must have a different operating frequency
from its immediate neighboring cells. This is to reduce the amount of interference
to an acceptable level. The frequencies are reused in a pattern, with the
spacing between cells using the same frequency determined by the reuse
factor. The required frequency reuse factor depends on the interference
tolerance of the transmission system. Analog systems typically require
a carrier to interference ratio (C/I) of greater then 18 dB [18],
which requires reuse factor of 1/7 (see Figure 39 (b)). Most digital systems
only require a C/I of 12 dB, allowing a reuse factor of 1/3-1/4 (see Figure
39 (a)). CDMA however, uses the same frequency in all cells, thus ideally
allowing a reuse factor of 1 (see Figure 39).

Figure 39 Frequency reuse patterns for (a) 3 frequencies (Digital systems), (b)
7 frequencies (Analog FDMA), (c) CDMA
In practice, the frequency reuse efficiency
of CDMA is some what lower 1, as neighboring cells cause interference,
thus reducing the user capacity of both systems. The frequency reuse factor
for a CDMA system is about 0.65 [16]. Figure 40 shows the interference
from neighboring cells. Note that most of the neighboring interference
is from the immediate neighbors of the cell.
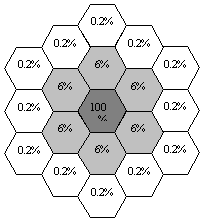
Figure
40 Interference contributions from neighboring cells in a CDMA system (source
[16]).
The cell capacity for a multi-cellular
CDMA system equal to the single cell capacity reduced by the frequency
reuse factor. Table 20 shows the effect of this on the CDMA capacity. The
cell capacity for CDMA is very low if voice activity detection and cell
sectorization is used. A straight CDMA system can only have somewhere between
5-11 users/cell/1.25 MHz. Using cell sectorization and voice activity detection
allows the capacity to be increased by up to 6.4 time, allowing somewhere
between 30-70 user/cell/1.25 MHz.
OFDM would require a frequency reuse pattern
to be used in a multi-cellular environment to reduce the level of inter-cellular
interference. The C/I required would need to be greater then ~12 dB (see
Gaussian Noise Tolerance of OFDM, section 2.2.3). This could be done with
a frequency reuse factor of ~3. This should easily be able to be achieved
as cell sectorization could also be used to reduce the level of interference.
This would result in the cell capacity for OFDM to be approximately equal
to 128/3 = 42.7 users/cell/1.25 MHz in a multicellular environment. The
matches the same user capacity as CDMA for an Eb/No of
8 dB and using cell sectorization and voice detection.
| Eb/No(dB) |
Expected Bit Error Rate (BER) |
Max. No. Users for single cell (no voice detection, no cell sectorization) |
Max. No. Users for single cell (voice detection, cell sectorization) |
| 6 |
0.023007 |
11.1
|
67.3
|
|
8
|
0.006004
|
7.2
|
42.7
|
|
10
|
0.000783
|
4.8
|
27.2
|
|
12
|
3.43E-05
|
3.3
|
17.2
|
Table 20 Predicted cell capacity for a CDMA cell in a multi-cellular enviroment,
for a process gain of 64.
Next Conclusion
|


