|
By Eric Lawrey, Copyright 1997
This page shows some OFDM examples to demonstrate
the effect of noise on the OFDM signal and several other tests. The aim
was to be able to demonstrate these effects on the OFDM signal.
| Parameter |
Value |
| FFT size |
2048 |
|
Number of Carriers
|
800
|
|
Guard Period
|
512 samples
|
|
Guard Type
|
Half cyclic extension, half zero amplitude
|
|
Sample rate of OFDM signal
|
44.1kHz
|
|
Bandwidth
|
17.5kHz
|
 Original Sound Transmission (Music by the Corrs)
The small sound clip was used as the data
source for the OFDM transmission. The wavefile was transfered across the
simulated link as channel noise was varied. This shows effect of the channel
noise of the data being transfered.

Figure 1 Complete OFDM signal for sound
transmission (using QPSK)
 OFDM
signal (683kB) OFDM
signal (683kB)
| Parameter |
Value |
| Multipath |
None |
| Peak Power Compression |
None |
| Input Data Wave Format |
4.33sec, Mono, 11kHz, 8bit |
| OFDM signal length |
15.26sec |
| Parameter |
Result |
| SNR |
12dB |
| Bit Error Rate |
0.000277 |
| RMS phase error |
12.1 degrees |
| Total Number of errors |
53 |
| Received Data |
 SNR12dB_QPSK.wav (47kB) SNR12dB_QPSK.wav (47kB) |
| Parameter |
Result |
| SNR |
8dB |
| Bit Error Rate |
0.02145 |
| RMS phase error |
19.37 degrees |
| Total Number of errors |
4105 |
| Received Data |
 SNR8dB_QPSK.wav (47kB) SNR8dB_QPSK.wav (47kB) |
| Parameter |
Result |
| SNR |
4dB |
| Bit Error Rate |
0.1591 |
| RMS phase error |
33.31 degrees |
| Total Number of errors |
3.044e+004 |
| Received Data |
 SNR4dB_QPSK.wav (47kB) SNR4dB_QPSK.wav (47kB) |

Figure 2 Complete OFDM signal for sound transmission (using QPSK)
 OFDM
signal (203kB) OFDM
signal (203kB)
The 256PSK modulation was achieved by sending
each 8bit sample of the input data sound file, was sent as one carrier
on one symbol. Using this, the amplitude of the input wave file is mapped
to a proportional phase angle, thus any phase error occuring in the transmission
results in noise on the data soud file.
| Parameter |
Value |
| Multipath |
None |
| Peak Power Compression |
None |
| Input Data Wave Format |
4.33sec, Mono, 11kHz, 8bit |
| OFDM signal length |
4.702sec |
| Parameter |
Result |
| SNR |
12dB |
| Bit Error Rate |
0.9534 |
| RMS phase error |
11.89 degrees |
| Total Number of errors |
4.561e+004 |
| Received Data |
 SNR12dB_256PSK.wav (47kB) SNR12dB_256PSK.wav (47kB) |
| Parameter |
Result |
| SNR |
8dB |
| Bit Error Rate |
0.9716 |
| RMS phase error |
19.35 degrees |
| Total Number of errors |
4.648e+004 |
| Received Data |
 SNR8dB_256PSK.wav (47kB) SNR8dB_256PSK.wav (47kB) |
| Parameter |
Result |
| SNR |
4dB |
| Bit Error Rate |
0.982 |
| RMS phase error |
33.05 degrees |
| Total Number of errors |
4.698e+004 |
| Received Data |
 SNR4dB_256PSK.wav (47kB) SNR4dB_256PSK.wav (47kB) |
|
256PSK wuth Data Averaging
|
4 repeats of each symbol were sent using
256PSK modulation. This gives the same data rate and bandwidth as QPSK.
The phase angle of the 4 repeats of each symbol were averaged at the receiver,
effectively reducing the noise by 6dB. This results in the signal having
better performance then QPSK for SNR conditions <~9dB.

Figure 3 Clipped OFDM signal (clipped by 12dB)
 OFDM
signal (683kB) OFDM
signal (683kB)
| Note: The clipped OFDM signal
is much louder as the peak to RMS power of the signal is much lower, resulting
in more signal energy of the same maximum amplitude. The signal was rescaled
back up in amplitude after clipping. |
In this test the OFDM signal is clipped
so that the peak power of the signal is reduced. Clipping of the OFMD signal
causes intermodulation distortion leading to an increase in the bit error
rate. This test also shows the peak to RMS power ratio for the OFDM signal
before and after clipping. The non-clipped OFDM signal has a peak to RMS
power ratio of 13.8dB, which is quite high. This could explain why clipping
the signal by up to 9dB has little effect on the error rate.
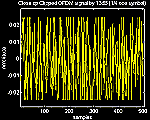
Close up of 12dB clipped OFDM signal

Click on the image for larger version
This shows a close up of the clipped OFDM
signal. It can be seen that the signal is still very complex, however the
signal is more dense the the original signal |
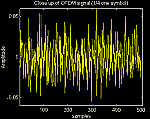
Close up of original OFDM signal

Click on the image for a larger version
This is a close up of the OFDM signal.
It shows that the signal simply looks like white noise.
|
The next table shows the effect of clipping
a normal wave file. The original sound file was clipped in the same way
as the OFDM signal, to give an idea of how much distortion is caused by
clipping a signal. Clipping the signal doesn't have as much effect as you
would expect. The music is still quite understandable.
| Peak Power Compression |
12dB |
20dB |
| Clipped Original Wave File |
 (47kB) (47kB) |
 (47kB) (47kB) |
| Parameter |
Value |
| Multipath |
None |
| Input Data Wave Format |
4.33sec, Mono, 11kHz, 8bit |
| OFDM Max Signal Level |
0.0889 |
| OFDM RMS Signal Level |
0.0182 |
| OFDM Peak to RMS power ratio |
13.7635dB |
| OFDM signal length |
15.36sec |
The results in the above table are for the original OFDM signal before any clipping.
| Parameter |
Result |
| Peak Power Compression |
12dB |
| Bit Error Rate |
0.003543 |
| RMS phase error |
15.14 degrees |
| Total Number of errors |
678 |
| Max Signal Level |
0.02174 |
| RMS Signal Level |
0.01393 |
| Peak to RMS power ratio |
3.867dB |
| Received Data |
 COMP12dB_QPSK.wav (47kB) COMP12dB_QPSK.wav (47kB) |
| Parameter |
Result |
| Peak Power Compression |
20dB |
| Bit Error Rate |
0.1205 |
| RMS phase error |
29.59 degrees |
| Total Number of errors |
2.306e+004 |
| Max Signal Level |
0.008691 |
| RMS Signal Level |
0.007097 |
| Peak to RMS power ratio |
1.76dB |
| Received Data |
 COMP20dB_QPSK.wav (47kB) COMP20dB_QPSK.wav (47kB) |
|


